© 2013 Plum Group, Inc. All rights reserved.
| 3. Summary Reports Filters |
Next |
On your summary report, you can begin to analyze the data that was given for your survey by respondents. If you selected Bar, Pie, Tables, and History for Views in your options, then you will immediately see this data for the first question of your survey on your reports page. To remove or add a view to your page, you can click on any of the four buttons symbolizing the bar graph, pie chart, tables, and response history.

Notice that all 4 views are selected. The table shows you the number of respondents who selected a particular response and the percentage right next to it. To the right of the table, there is a bar graph that shows the percentage of respondents who selected a particular response. Following the bar graph is a pie chart that also shows the percentages of respondents who selected a particular response. Below these tables and charts is the response history. Notice that the x-axis of the graph represents the time that respondents selected a particular response while the y-axis represents the percentage. The different lines on the graph represent the different response choices for that question.
To view a different page of data for your survey, simply click on one of the page icons located next to your survey title.
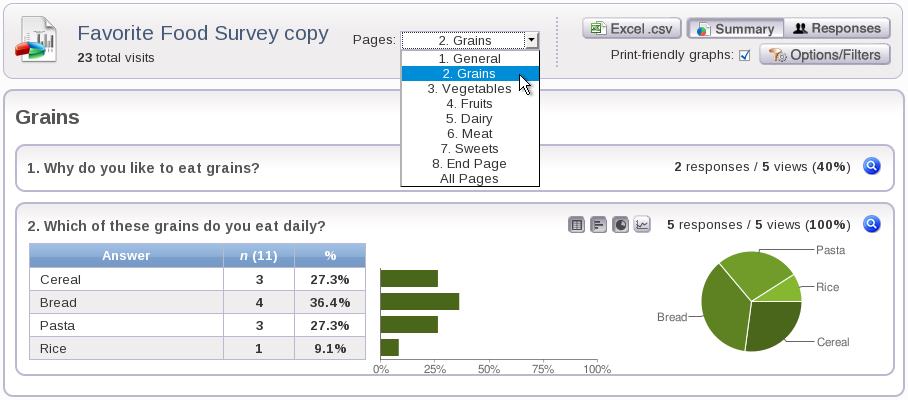
You can also choose to analyze all of the data on one screen by clicking on the page icon for All.
If you didn't select PNG for Chart Rendering, you can still convert your charts into print-friendly format by clicking on the checkbox for "Print-friendly graphs:".

You can also view all the responses that were given for a particular question. First, click on the blue "View" icon.

This will open up a window that will allow you to see all the responses that were given for that question.

To view your report in Excel .csv format, you can click on the Excel.csv button.

Once you click this button, a window should appear, allowing you to download your responses into .csv format.
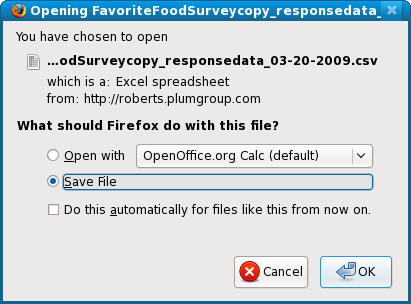
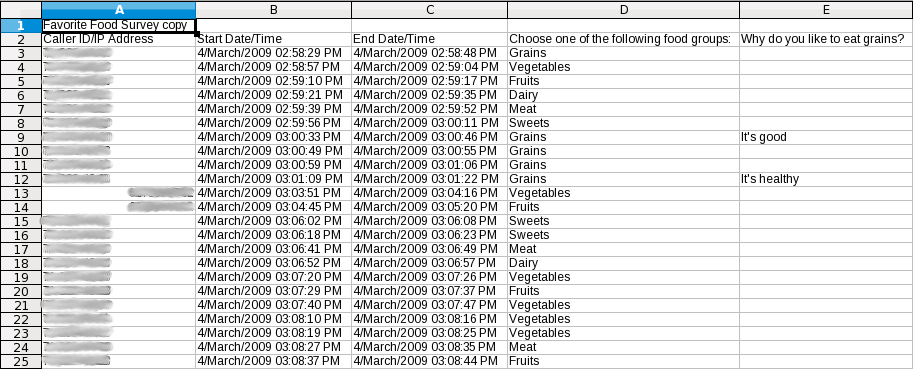
Once you've downloaded your responses into this format, you should be able to view them from within Excel.
| 3. Summary Reports Filters |
Next |