© 2013 Plum Group, Inc. All rights reserved.
| 1. Individual Responses |
Next |
You can view your responses in a report by using Summary Reports.
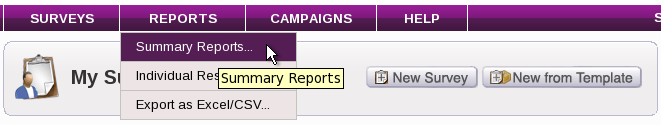
To view a summary report for your survey, first place your mouse on the "Reports" header as shown below and click on Summary Reports.
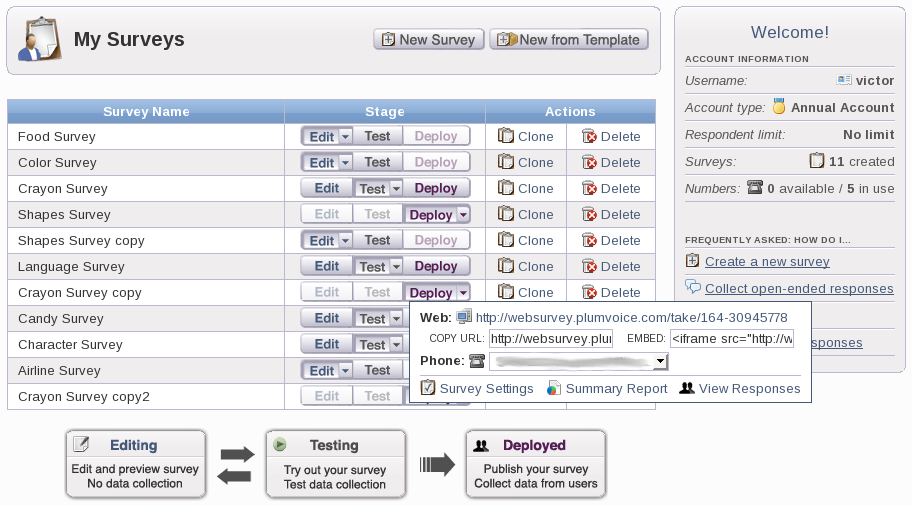
Similarly, you can also do this by clicking on the Test or Deploy tab for the desired survey and then clicking on Summary Report.
You should then be led to a Summary Reports page where you can select what you want to view in your report.
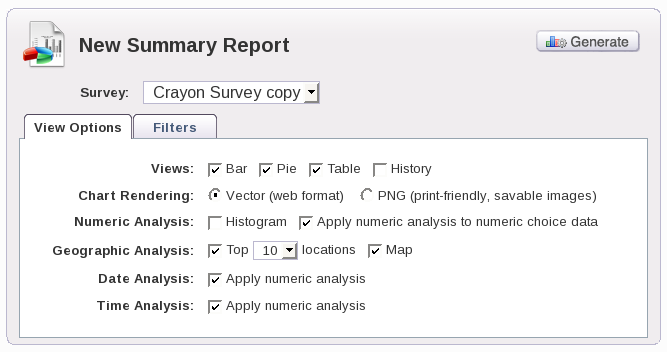
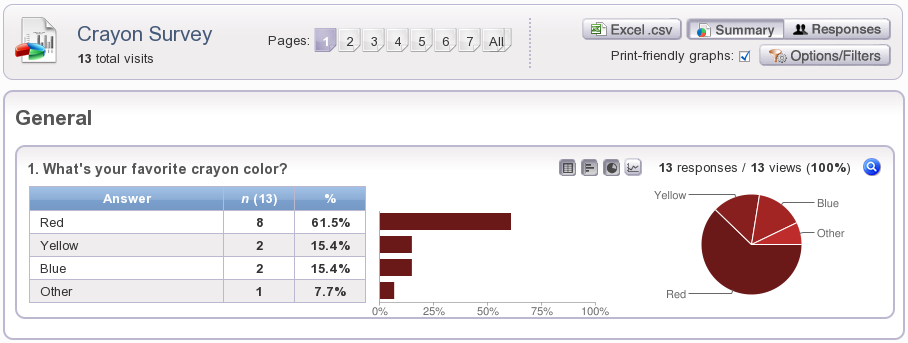
For Views, you can select if you want to include bar graphs, pie charts, tables, and the response history in your report. If you check the box for Bar, you will see bar graphs of your data in your report. Checking the box for Pie will include a pie chart in your report, checking the box for Table will include a table for your data, and checking the box for History will include the response history. The response history will allow you to view how respondents answered a particular question over time.

For Chart Rendering, you have two options for how you want to view your charts: Vector and PNG. Selecting Vector will allow you to view your charts in web format, where you can view percentages of responses on your chart. Selecting PNG will allow you to view your charts in a print-friendly format, where you can copy and paste your charts into a document. However, you would not be able to view percentages for your pie charts.
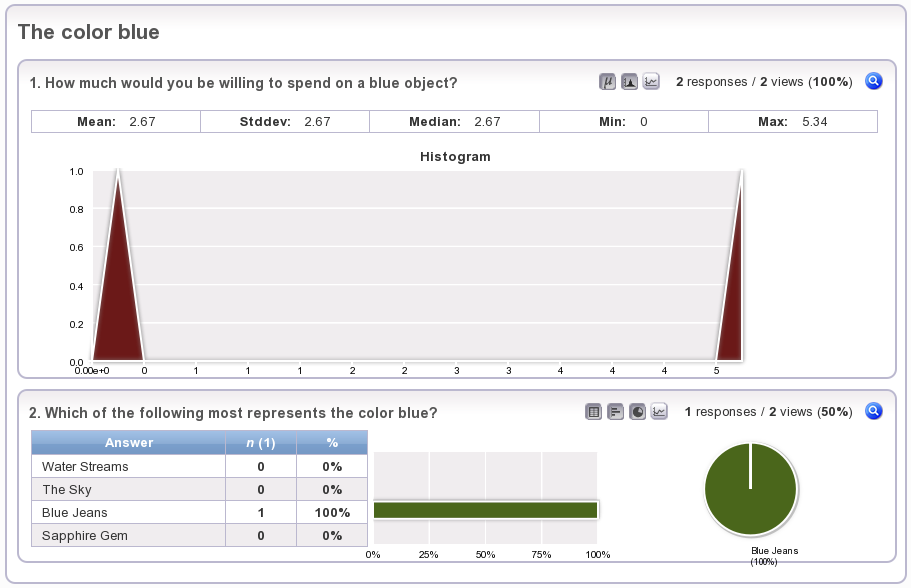
For Numeric Analysis, you can view statistical data and histograms for numeric type questions. You can check the box for Histogram if you want to view histograms for the following questions types: currency, numbers, digits. You can also check the box for Apply numeric analysis to numeric choice data if you want to view statistical data for the following question types: scale, currency, number, digits. This statistical data includes the mean, median, standard deviation, and the minimum and maximum value given for that question.
For Geographic Analysis, you can check the box for Top locations if you want to include a table of top locations in your report for the following question types: full address, state/province, city,state/province. You can also select if you only want to include the top 5 locations or top 10 locations in this table by selecting one of these choices from the drop-down box. For Map, check the box if you want to include a map of the United States in your report that would highlight the states given as responses from your survey.

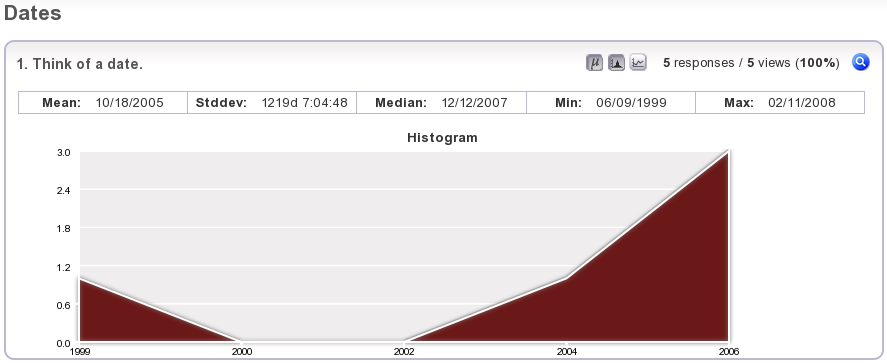
For Date Analysis, you can view statistical data and histograms for your date question. You can check the box for Apply numeric analysis if you want to view statistical data for date questions such as the mean, median, standard deviation, and the minimum and maximum date. For Time Analysis, you can view statistical data and histograms for your time question. You can check the box for Apply numeric analysis if you want to view statistical data for time questions such as the mean, median, standard deviation, and the minimum and maximum time.
Once you have selected the information that you want to view in your report, you can click on the Filters tab to create filters for the responses for your report.
| 1. Individual Responses |
Next |